
Motivating Problem
- The current process for interpreting blood films within a haematology lab involves automated haematology analysers. These machines perform blood cell counts autonomously however when a sample is flagged, the blood smear must be reviewed manually which is extremely labour intensive.
- Furthermore, in some rural/regional areas where haematology labs are too expensive, blood samples have to be sent to metropolitan areas to be analysed.
- Our overarching goal is to be able to automate the identification of diseased white blood cells within a sample and present them to a haematologist for confirmation.
Computer Vision Types
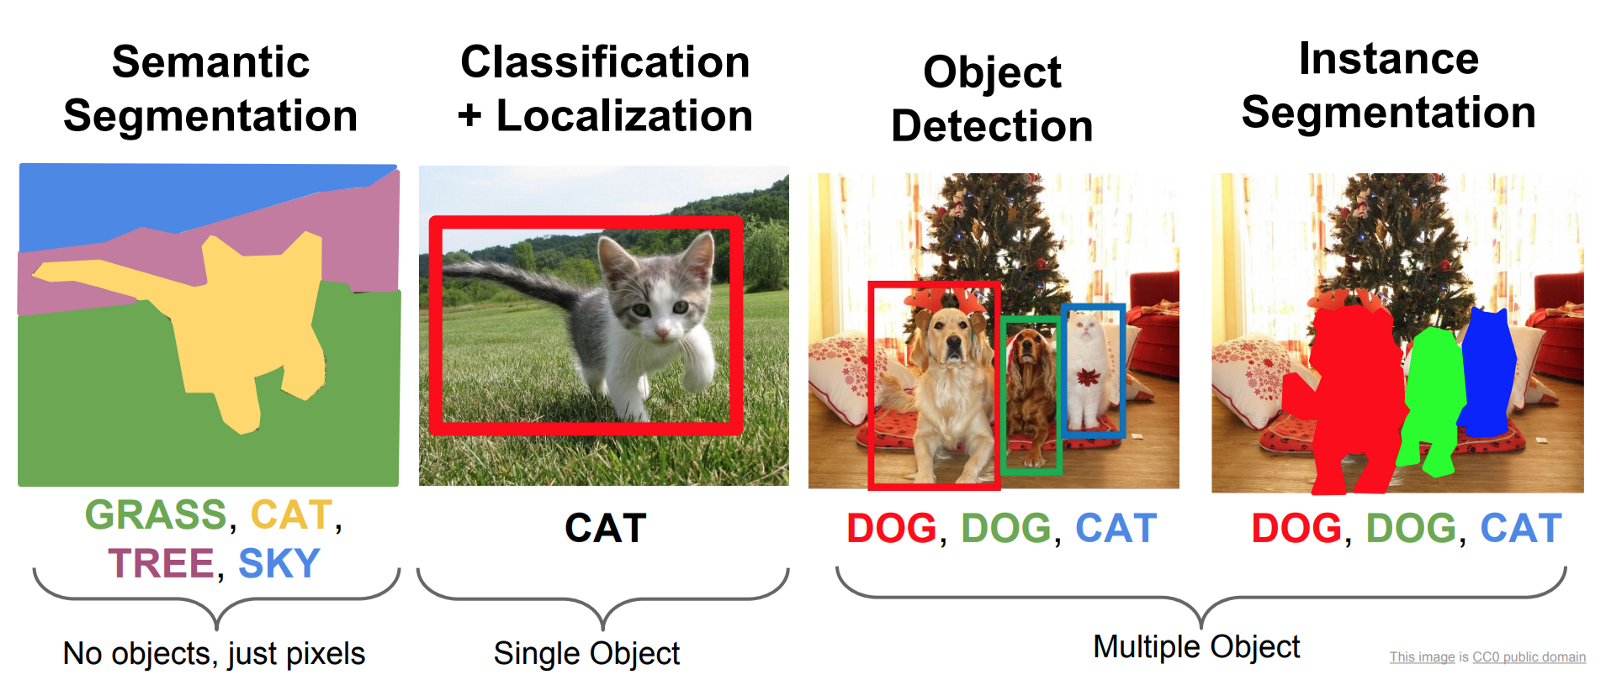
There are broadly three main types of basic computer vision tasks that a model can be trained to do.
- Object classification, for instance identifying whether a WBC is an eosinophil or a basophil.
- Object detection, for instance finding the location and bounding box of a WBC.
- Object segmentation, which involves highlighting which pixels of an image belong to an object.
Datasets
There were limitations to the datasets available. In an ideal world a dataset would have bounding boxes with very granular WBC-type classifications e.g. basophil, eosinophil, lymphocyte, monocyte, neutrophil. I had the following:
- BCCD Dataset - contains bounding boxes for white blood cells (WBCs), red blood cells (RBCs) and platelets which makes it great for training an object detection model. The downside is it doesn't contain WBC types which present pathology in different ways.
- Acevedo et al. Dataset - contains individual labelled cells but no bounding boxes. Great for training an object classification model.
- Unlabelled images from a hematology lab at Royal Prince Alfred Hospital - importantly these were likely pathological.
The Approach
Stage 1 - Detecting WBCs
I used the BCCD dataset to train an object detection model to detect WBC, RBC and platelets and draw boxes around them. You can see that it struggles a little to separate overlapping RBCs because of their homogeneity. I'm not overly fussed as the focus is on the WBCs.
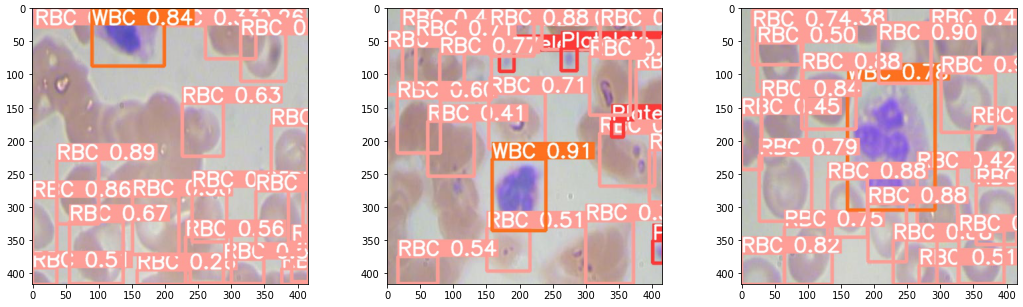
A challenge that cropped up was scaling. The model performed well on the image dimensions it was trained on but trying to apply the model directly to an image where cells were much smaller is not feasible. That's where slice-aided hyper inference (SAHI) came to the rescue. It divides the input image into overlapping patches and inferenced over. Bounding boxes are then scaled back to the original image coordinates.
Stage 2 - Cropping out WBCs & Classification
Since I don't have a dataset with specific labelled WBC types on bounding boxes, I have to first crop out the WBCs from the original image and then train a separate classifier to differentiate between those WBCs. There are some suprising challenges with that:
- How do you deal with a bounding box that runs off the edge of the image?
- Classifiers need standard image sizes e.g. all squares but bounding boxes can be any dimension they so please.
- How do you deal with multiple WBCs overlapping each other
I went with max(width, height) centred at the middle of the bounding box. Any crop dimension that leaked off the edge would be shifted back in. I won't bore you with the laborious batch cropping code but you can view the Github repository for more details.
Acevedo et al. dataset was already labelled with detailed WBC types. I then cropped WBCs out of the BCCD dataset which my supervisor Dr Alex Wong helped me label (we were desperately needed training data). I trained a simple ResNet18 classifier in PyTorch on all these training samples. Did they work on the out-of-sample test set? Of course not. Most cells were being incorrectly labelled as monocytes. Back to the drawing board. A couple reasons were possible:
- Perhaps the relative size of the WBCs was actually important information that was lost when I cropped out all the images and resized them all to the standard 224px by 224px. After all, monocytes are much larger.
- The poor image quality in low-quality scans might make differentiating WBC-types difficult because the granules (a big differentiating factor) is difficult to make out.
- Classification is often context-dependent e.g. the relative colour of a eosinophil to a basophil helps with differentiating one from the other
- Using a wonderful little explainability package lime you can also see that the positive detection isn't even using much of the nucleus at all! WBCs are meant to have very distinctive nuclei e.g. neutrophil with a horseshoe-shaped nucleus.
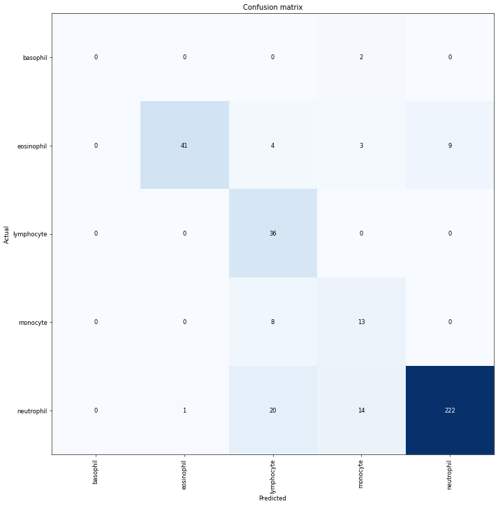
To retain relative size information, I tried to scale WBC crop size relative by matching the average RBC size across images - effectively using RBC size as a yardstick. Nice idea in theory but no dice. I got a bit of break when I tried pre-processing image augmentation. A gauntlet of augmentations (Random Erasing + Random Resized Crop + Flip + Rotation + Hue/Saturation/Brightness) produced the best results with an out-of-sample accuracy of 0.84 on a dataset completely different in source from the training set. Although these results are heavily skewed by the imbalanced dataset with far more neutrophils.
Stage 3 - Diseased WBCs & Future Work
I never quite got the chance to hit this stage but it's still conceptually interesting to discuss. It was just at this moment that my Centenary Institute Summer Research scholarship concluded. The original plan was to try and further build a classifier that could distinguish diseased from normal WBCs. However, since doing this project, I think there could be a more interesting, novel approach. If we have large amounts of unlabelled training data, we could just apply contrastive learning and see if the latent features cluster nicely into disease/non-disease. Perhaps I may revisit this project again some time.